A plugin portfolio doubles at the right moment
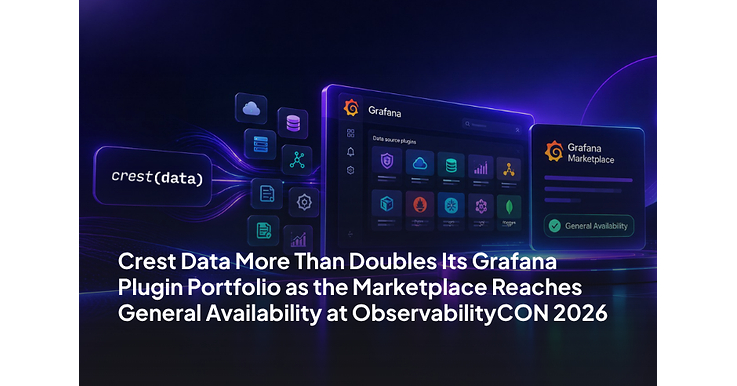
Crest Data announced 15 new commercial Grafana plugins on October 21, 2026, from San Francisco, more than doubling its marketplace portfolio from roughly 10 to 25 native, agentless data-source plugins built in partnership with Grafana Labs. The announcement coincided with ObservabilityCON 2026, running October 19 through 21 at Pier 27, where Grafana Labs took its Marketplace to general availability. The timing is not incidental: a plugin vendor doubling its catalog on the same day the marketplace itself exits beta is a coordinated signal to the market about where both companies expect demand to come from next. For a security or platform leader who has watched their monitoring stack grow by one more specialized tool every time a new system category gets adopted, that coordination is the clearer signal than either announcement read alone.
The new plugins span five categories: security tools including FortiGate, Zscaler ZIA and ZPA, Wiz, Qualys, and Tenable; network systems including Cisco Meraki and Akamai; virtualization platforms including VMware vSphere and Citrix; SaaS applications including Tableau, Zoom, and SharePoint; and storage and data-protection systems including NetApp ONTAP, Dell PowerScale, and Rubrik. That spread covers security, infrastructure, productivity, and storage monitoring inside a single visualization layer, which is a broader scope than most observability vendors attempt to cover natively on their own.
Agentless and API-based is the operative design choice
Crest Data's plugins are described as agentless and API-based, which matters more than it might sound. Agent-based monitoring requires installing and maintaining a collector on every monitored system, a maintenance burden that compounds as the number of monitored systems grows into the dozens or hundreds across security, network, virtualization, SaaS, and storage domains. An API-based, agentless approach instead pulls data directly from each system's existing management API, removing that deployment and patching overhead entirely.
The plugins also come with pre-built dashboards, which lowers the time-to-value for a platform team that would otherwise need to design visualizations for each new data source from scratch. Crest Data co-founder and CEO Malhar Shah said the plugins unify IT, platform, and security monitoring in Grafana, a framing that positions this less as 25 separate point integrations and more as a single consolidated monitoring layer that happens to pull from 25 different systems underneath it.
The cost argument: avoiding separate ingestion
The specific cost claim behind this release is that teams can monitor these systems inside Grafana without separate consoles or extra data ingestion costs. That second part matters most financially. Many observability platforms charge based on data volume ingested, which means pulling telemetry from 25 additional systems into a separate monitoring tool can scale cost sharply as those systems' log and metric volume grows. An agentless, API-based plugin that queries source systems directly rather than ingesting and storing their full data stream sidesteps that cost model.
For a platform or security leader currently paying ingestion costs across several specialized monitoring tools for systems like Zscaler, Wiz, or NetApp, this is worth a direct cost comparison: what is the current combined ingestion and licensing spend across those separate tools, versus a single Grafana instance with Crest Data's plugins layered on top. The answer will depend heavily on existing contract terms and data volumes, but the comparison itself is a straightforward exercise worth running before the next renewal cycle.
What Grafana Marketplace's GA status signals
Grafana Labs reaching general availability on its Marketplace at the same event where Crest Data doubled its plugin catalog indicates Grafana is leaning into a partner-built plugin ecosystem as its growth strategy, rather than building and maintaining native integrations for every enterprise system in-house. Ash Mazhari, Grafana Labs' VP of Corporate Development, called Crest Data a leading contributor to the ecosystem with strong traction for its plugins, a direct endorsement that frames Crest Data as a reference case for what the marketplace model is supposed to produce.
That strategy carries a dependency tradeoff familiar from any plugin marketplace: the breadth and quality of third-party integrations increasingly determines how useful the core platform is, which shifts a meaningful share of platform risk onto Grafana's partner ecosystem alongside Grafana itself. A platform team adopting Grafana for broad enterprise monitoring should factor in the health and update cadence of the specific plugin vendors, like Crest Data, whose integrations the monitoring strategy would come to depend on, in addition to Grafana's own product roadmap. Vendor concentration risk in a plugin ecosystem is easy to overlook until one widely used plugin falls behind on maintenance.
The consolidation decision this creates
The underlying strategic question for any platform or security leader is whether a single visualization layer with wide, agentless plugin coverage across security, network, virtualization, SaaS, and storage domains beats maintaining several specialized monitoring tools that are each individually stronger in their own narrower domain. Consolidation reduces tool count, context-switching for on-call engineers, and duplicate ingestion costs. Specialized tools often offer deeper, domain-specific analysis that a general-purpose dashboard layer cannot fully replicate.
The practical test is a workload-by-workload audit rather than an abstract preference between the two models: which of your current specialized monitoring tools are used primarily for dashboarding and alerting that Grafana with the right plugin could replace outright, and which are used for deep forensic or investigative capability that a dashboard layer was never meant to provide. That audit, run against your actual tool inventory and renewal dates, is the real decision Crest Data's expanded plugin catalog puts in front of you. Running it now, ahead of renewal season, gives you leverage in contract negotiations either way the audit comes out.